
Geoengineering
Weather Channel Founder John Coleman Categorically Denies Climate Engineering Reality


Dane Wigington
geoengineeringwatch.org
Who is John Coleman? Why would he go to so much effort to try and “debunk” the climate engineering reality? Even more importantly, why would anyone who claims to be fighting the geoengineering insanity post information from Coleman as if he were an oracle of truth? Unfortunately, a few anti-climate engineering activists and individuals have blatantly ignored Coleman’s climate engineering denial in order to post his climate change denial rants. John Coleman was one of the Weather Channel founders, but he is NOT a meteorologist or a climatologist. In fact, Coleman is not a scientist at all, but rather he has a journalism degree. This does not automatically discredit everything he says, but are his conclusions backed up with credible data? In regard to both subjects mentioned above, the answer is clearly no. National Radio show announcer Jack Blood publicly challenged John Coleman to debate the climate engineering issue on the air with me, Coleman refused. The Washington Post asks “Why Does Anyone Pay Attention To John Coleman”? It does seem Coleman is just the sort of “journalist” the power structure likes to use for putting out messages of denial on subjects like geoengineering and climate change. So what has Coleman said about climate engineering? The video below is from Coleman, why would anyone who claimed to be fighting geoengineering post information from such a source?
Viewing Climate Engineering Through A Clear Lens
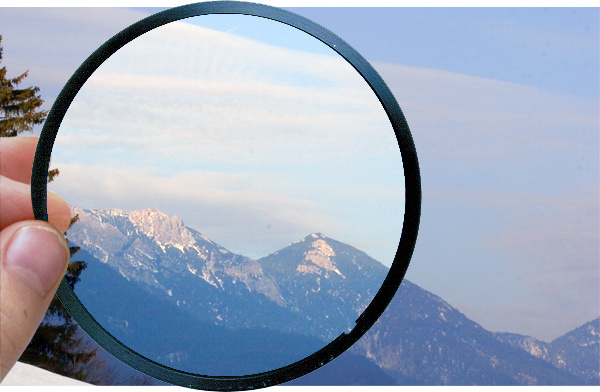
Many that claim to be in the fight to expose and stop climate engineering are forcefully and slanderously pushing the exact narrative given to them by the very power structure which is itself behind the geoengineering. Those that are pushing the well funded disinformation also spend much of their time slandering any who dare to dispute their unsupportable and incorrect conclusions. Posting inaccurate and false data does much harm in the fight against geoengineering. It costs our cause much credibility and creates much division. This being said, the more of us there are who do look at solid and verifiable data from proven sources, and post the same, the better we can advance the credibility of the anti-climate engineering movement. Some recent and important links to understand and share are below. I realize many are still struggling with their disdain for Gore and those like him (Gore is a hypocrite and is himself a part of the global power structure), but we must all get past that. Reality has nothing to do with such bias. Who would want us all to think that looting, pillaging, and plundering the planet has no negative effect or consequence? Who would want us to think that all the cool-downs are natural? Who wants to keep “business as usual”? Who would want to hide the magnitude of what is unfolding till the last moment? Bias and preconception is tough to get rid of, but we must all keep polishing the lenses through which we see the world. We MUST NOT throw the baby out with the bathwater. Sharing credible data with qualifying commentary is important for all of us to do as our time permits. The planet is not just warming, it’s in meltdown. Huge and well funded special interests are doing their best to hide this fact and the climate engineers are part of this effort, as is mainstream media. Global climate engineering is making an already bad situation far worse and poisoning all life in the process, let’s all do our best to sound the alarm with credible facts and data. The links below are important to consider in this effort, these links are the point of this post.
Dane Wigington
geoengineeringwatch.org
http://www.sciencedaily.com/releases/2014/11/141129075729.htm
http://mediamatters.org/blog/2012/11/28/meet-the-climate-denial-machine/191545
http://www.livescience.com/26618-climate-change-denial-koch-donors-trust.html
http://www.theguardian.com/environment/2013/feb/14/funding-climate-change-denial-thinktanks-network
What Does The Union Of Concerned Scientists Say About Sea Level Rise?
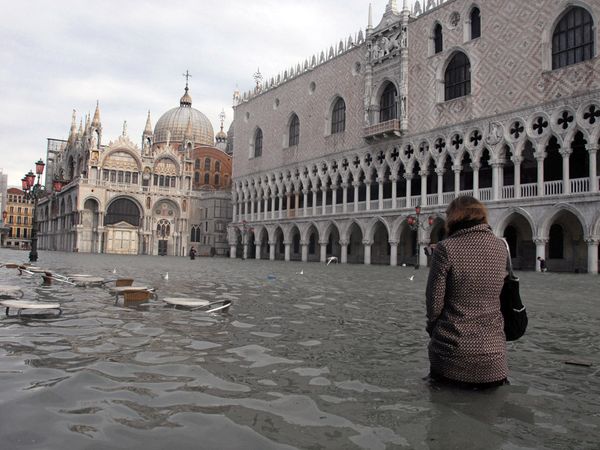
Why is the power structure and the mainstream media they control, trying so hard to confuse the population on the reality of sea level rise? Because if the population truly understood the gravity and immediacy of what is unfolding it would cause an immediate paradigm shift. Those in power are doing their best to delay public awakening as long as possible while they prepare for total collapse. Sea level rise alone will radically alter coastlines around the globe with catastrophic impacts on dozens of major cities located at sea level (this is not to mention all the other impacts from the warming). Mainstream media and special interest organizations have successfully confused many on the warming/cooling issue. The climate engineering insanity has further completely confused the population with highly toxic engineered “cool-downs” which are making the overall warming worse still. What does the largest independent body of scientists in the world say about sea level rise? It’s happening rapidly and all available data fully supports this fact. Can sea levels rise on a “cooling” planet? No. can formally frozen methane deposits thaw and release on a “cooling” planet? No. Would forests burn to the ground around the globe at a rate many times normal if the planet was cooling? No, again. If the anti-climate engineering community is to gain the credibility necessary to expose and stop geoengineering, we must know the facts so we are standing on solid ground. Climate engineering has been skewing the Earth’s life support systems for over 60 years. The damage from climate engineering has added greatly to the overall damage done to the planet from many forms of human activity. All of us must abandon ideology and stand on facts from the most credible and verifiable sources.
Dane Wigington
GeoengineeringWatch.org
Record Warm Oceans And Eco System Collapse
The climate engineers are confusing some of the population with their jet stream manipulated chemical ice nucleated engineered temporary “cool-downs”, but the bottom line for the temperatures on our planet are the oceans. A cubic meter of sea water can carry 4000 times the thermal energy of a cubic meter of air. Global ocean temperatures are shattering high temperature records month after month (GLOBAL land temperatures are also being shattered). All of this is happening even without an “el nino” event which will sooner or later make the whole situation much worse still. The climate engineers have been actively trying to push back the el-nino by holding the “ridiculously resilient ridge” of high pressure over California. This alters the trade winds which helps to hold in the heat the Pacific Ocean is trying to release. Those that want the truth about the actual state of the climate will examine breaking information with actual statistics and facts from the ground instead of fabricated headlines from people and special interest groups with agendas. In the meantime, the mercury is continuing to rise on planet Earth. The ongoing climate engineering insanity is making an already critical climate situation exponentially worse overall.
Dane Wigington
geoengineeringwatch.org
The Silencing Of Scientists As The Power Structure Takes Control
The human race and all life on Earth is plummeting toward extinction on the current trajectory, where is the voice of reason and science? The cancer that is the global power elite has successfully paid off, threatened, corrupted, or otherwise silenced the scientific community that should be sounding the alarm on countless fronts. Now, special interests are the source of the “science” that determines our collective fate. From the blatantly visible climate engineering assault taking place in our skies day in and day out, to the GMO insanity and countless things in between, the unravelling of the biosphere and the web of life is accelerating rapidly. The global population must be awakened to the war that is being waged against them by those in power. So many in the science community will come out from the shadows if we the people can provide the cover to do so. All must do their part to sound the alarm. The 2 minute video and article below are shocking testimonials as to the hijacking, corrupting, and/or ignoring of the science community at all of our peril.
Dane Wigington
geoengineeringwatch.org
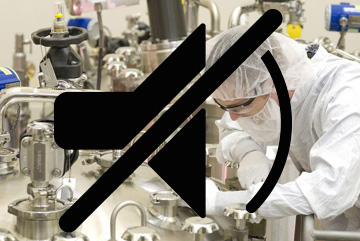
Smart Grid Exposed – Take Back Your Power – Documentary by Josh del Sol

Source: Rebel Siren
What do we really know about Smart Meters, other than the usual propaganda about how “they are good for us”, “they will save us money”, “they are safe”? Let’s find out, are Smart Meters really so “smart” (or safe, or cost effective)?
Apparently, not for the consumer, but they are extremely smart for the power companies that are using them to hike up people’s bills, then shut off their power until they agree to pay the increased costs. And, indirectly, for the medical profession and mortuaries that profit from the illness and death that overexposure to EMR/EMF/RF radiation causes, and for the contractors that get hired to rebuild someone’s home after the fire damage caused by so called “Smart Meters” that were improperly installed by under-trained technicians. And, maybe even for lawyers hired to represent victims of forced Smart Meter installation. But, for us (the consumer), not so much.
A Shocking Dose Of Climate Reality

Climate Engineering And The Polar Vortex Conveyor
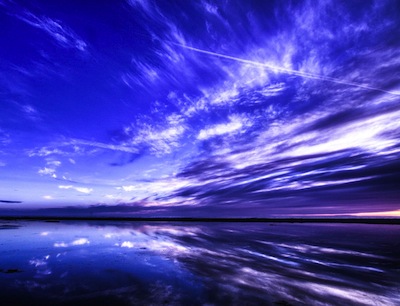
Where Have All The Blue Skies Gone
I think that we have all noticed that our temperatures outside have been in a flux. One day it is above normal and the next day below normal, not only in New England but across the Globe. Something is definitely happening to our weather and climate. Doing some research, I have discovered that the US Air Force wants to control the weather by 2025. It is documented.
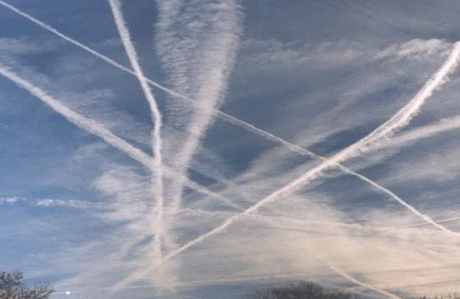
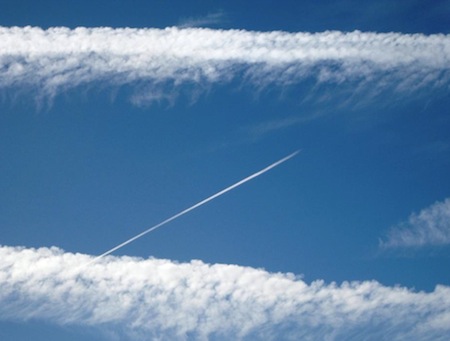
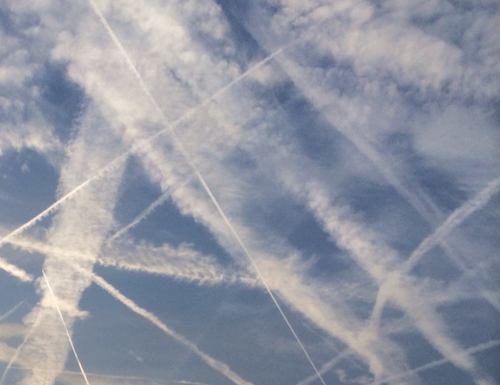
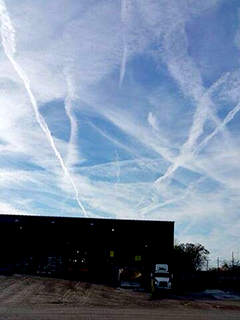
If you LOOK UP at the sky, you will notice that the sky is not blue for very long, even on a blue sky day. Instead, you will often see streaks of white plumes in the sky from planes, sometimes in patterns of a criss-cross or straight line or tick, tack, toe. These plumes after awhile begin to widen and blanket the blue sky turning it into a milky white. It has been verified with air, water and soil samples; by climate engineering patents, and videos that these streaks are aerosol trails of toxic chemicals of barium, strontium, aluminum oxide and other synthetic fibres being sprayed daily into the stratosphere by military and some commercial planes. A reason for the spraying of our skies on a global basis according to David Keith of Harvard, who recently spoke on the Colbert Report Show, is to cool down the temperature of the Earth. The name given to this process is Global Climate Engineering (Intervention) or Weather Modification, also known as Solar Radiation Management (SRM).
As much as the climate engineers are trying to cool the Earth, Weather modification is wrecking our eco-system and hydrological system already set in place. Television documentaries have reported that 200 species are becoming extinct each day, as well as fish, birds and animals. Dane Wigington in a documentary has mentioned that plants, trees and bees are dying in California. Other authors have pointed out to us, that our ozone layer is being depleted; the sunlight is dimming; farms and gardens are producing less crops; aquifers are depleting; states and countries are experiencing droughts. Many of our friends or relatives and ourselves have seen an increase in floods; ice tsunamis; earthquakes; hail; hurricanes and tornadoes. We are nearly at the edge of the tipping point! Time is running out is becoming a familiar mantra!
Besides the spraying of these toxic chemicals, our weather is also being manipulated by HAARP (High Frequency Active Auroral Research Project). Both Nick Begich and Rosalie Bertell have written about this project in their books, and they can be heard on utubes online. Rosalie Bertell tells us that HAARP began in 1990 and work on the ionosphere facility in Gakona, Alaska began in 1993. HAARP is known as Tesla-based technology.
HAARP has ionosphere heaters that can heat sections of the Ionosphere to form a curved lens and also reflect massive energy beams back to Earth to trigger hurricanes, floods, droughts and earthquakes, as well as diverting them away from certain cities, states and or countries. It is known to have 24 heaters around the globe.
Such powerful technology to be in the hands of humans, without the complete knowledge of possible consequences of their usage and the moral authority to decide who has good weather today or not, or droughts for months on end! Is this not playing God with our weather and climate? Such hubris!
According to Professor James Fleming of Colby College in Maine, we are not the first generation to think about modifying and manipulating the weather and to change the climate. He tells us that as far back as 1841, James Espy tried to modify the weather. He tried to make artificial rain by burning forests. Other attempts to control the weather took place in the 1900’s beginning in 1904 with Charles Hatfield known as the Rainmaker who attempted to make it rain in California. Also again in 1915 when he supposedly caused it to rain for 17 days in San Diego by building a 20-30 foot tower which he climbed and then mixed chemicals claiming that by letting them evaporate in the atmosphere, he would attract rain clouds to open. Rain clouds did open resulting in deaths and the destruction of 100 bridges and people left homeless. As a result of the devastation, Mr. Hatfield was never paid the sum he bargained for. If you read, James Fleming’s work on FIXING THE SKY, you will find other examples showing that all throughout the 1900’s other various attempts were made to control the weather and climate not only by the United States but also by Russia.
So what is all this technological know how good for, if it is being used to destroy, rather than to promote responsible stewardship of the Earth? California, at present is in a terrible drought.
Where is HAARP in all of this? Why isn’t HAARP helping to bring moisture and rainfall to California, instead of the opposite?
As I reflect by my window and see trails of chemicals being released in our sky, day after day knowing that this will affect and effect our weather and our health, I can only ask what about the ETHICAL IMPLICATIONS of managing the world’s climate? Have policy makers taken this into account? Who will set the temperature for the Earth? What about the health issues of the citizens onto which the toxic chemicals mentioned above, fall day in and day out? Who are the policy makers accountable to for the consequences of Weather Modification? Alzheimers and autism are becoming rampant, as well as cancer and respiratory ailments. Are they not the results of these toxic chemicals?
Having this technology also raises the question about causing rain in one place that could risk causing drought in another place. Scriptures tell us that we are all one. So when one place is affected all is affected. Although I live at the opposite coast from California, I feel for the citizens there experiencing drought and devastation, also for the folks in Buffalo, New York, who recently experienced an unprecedented epic snowstorm. This brings to mind the words of Chief Seattle: “Whatever befalls the Earth, befalls the sons and daughters of the Earth.”
Scientists tell us that time is running out and that the only way to fix the weather and the climate is to leave the sky alone and instead reduce CO2 emissions and also Methane Emissions. May we all have the courage to do so! INSTEAD OF AN ICE BUCKET CHALLENGE, I challenge all who will read this to write or call President Obama and your legislators to encourage them to reduce CO2 Emissions and Methane Emissions, while leaving the sky alone.
Resources:
Angels Don’t Play HAARP by Nick Begich
Fix The Sky by James Fleming
Planet Earth: The Latest Weapon by Rosalie Bertell
Look Up (Documentary DVD) by Skyder Alert
GeoengineeringWatch.org website of Dane Wigington
The Rollout Of Geoengineering
Source: The Sleuth Journal, article by Bernie Suarez
The systematic pre-planned roll out of geoengineering and aerosol spraying of our skies is now in full swing. This attempt to roll chemtrails out to the general public was predicted and anticipated by many in the movement for years, but now we are seeing the actual implementation of the agenda. Chemical spraying nation-wide has been relentless for years. All of humanity has been watching planes dropping their artificial sustained chemical trails which artificially start and stop whenever chemical barrels are empty or when perhaps the person or system controlling the release of these chemicals from the planes needs to. All of this has been happening in broad daylight. We’ve watched as these unmarked planes with transponders in the off position sneak around the skies (go to flightaware.com and confirm this for yourself). These same non-passenger planes are known to loop around and fly back in the same path previously traveled.
Whistleblowers have come out and confirmed many segments of these mass operations. I have personally interviewed someone who had regular access to a large military Air Force base and confirmed the spraying of the “white stuff”. Others have taken up to sampling soil, water and air samples, all which have turned up exponentially high levels of improbable metals, and the accompanying pH increases that come with that. Many of the metals found just happen to match the metals required in the same weather modification patents issued to U.S. defense contractors. All of these metal elements are incompatible with life. All which have deleterious effects on all of nature, its life forms and its life cycles. All of these realities ignored by the U.S. government, its mouthpiece politicians and the mouthpiece geoengineers.
All of this information only confirms and vindicates the whistleblowers who have spoken out against chemtrails spraying operations. For years now, chemtrails operations have become common knowledge, having been exposed world-wide from deep in the trenches of the movement to the public and private letter writing efforts to politicians and other agencies informing and inquiring about these programs and asking for their help. At some point in say, the last 5-10 years the movement started getting attention from segments of media, but the script eventually became clear; chemtrails was to be denied and not talked about. Soon we saw those stories about chemtrails go away, ignored, side-step and even replaced by other environmental concerns.
Ohio Congressman Dennis Kucinich may have learned about the need to keep chemtrails in denial mode the hard way when his brother was mysteriously “found dead” in his own home. Was this foul play? Who knows, but this much is factually known, Kucinich was also the one who specified “chemtrails” in his Space Preservation Act of 2001. He wasn’t kidding. The opposition and its internet trolls would have you believe he didn’t really mean chemtrails. It was all a misunderstanding. Anyone believes this? We may not know who was behind the mysterious death of his brother, but we do know Kucinich never spoke about chemtrails again.
As for the movement against chemtrails, it has been met with as much resistance and propaganda as any movement. My hat goes off to the chemtrails-geoengineering activists. They’ve had to watch as the control system literally re-edits old movies and animated films to insert chemtrails into them. This is the same system that is re-educating the children that cirrus clouds and geometrically straight (tic-tac-toe) lines in the sky are part of natural cloud formation. We’ve watched paid trolls defend chemtrails by asserting (blindly) that persistent contrails is the ordinary phenomenon which explains how temperature-humidity variations dictate whether planes can change today’s weather in a matter of an hour or two. These are just some of the piles of lies that the chemtrails movement has been subject to, up to now that is.
Up to now, the globalists and their politician minions have been sitting on the deny card. This plan is about to change. The trick is how to go from covert to overt. How to say we admit we’re doing it, but then sell the item as a good thing. This is a job that can only be pulled off by Barack Obama and his administration. In times like these, you need a sales closer to close the deal. Someone who can convince the victim that the punishment is good for them. Like a master slave relationship. Look for example, at how Obama is selling mass surveillance to the American public, even comparing the dreaded NSA to American heroes like Paul Revere. The control system knows no one can sell tyranny to America the way that Obama can. They know that the time to flip the mass perceptions of various conspiracies against humanity is now, while the current president is in power, and there is no time to waste. The rolling out of geoengineering seems to be well within this timing.
The move to roll out geoengineering and chemtrails seemed to have accelerated after the September 2013 revelation that the Intergovernmental Panel on Climate Change (IPCC) was prepared to put out a climate report that admits the earth had actually been cooling since 1998. This information which conflicted with all the global warming claims had to be dealt with in a manner that is conducive to continued spraying and continued advancement of agenda 21 and global carbon tax. Thus since then the administration signed an executive order to take over all climate change legislation. Then SHOWTIME cable network launched ‘Years of living dangerously’; a TV show promoting global warming and its ties to climate change. This also called for late year press releases from media reminding viewers that global warming is still alive … in the form of global cooling, of course! This also pushed IPCC to put out the official claim that since 1998 we are simply in a global warming “pause”.
As if that wasn’t enough propaganda, the control system then launched an attempt to go for it all. In early December 2013 government geoengineering front man David Keith goes on a national TV late night show and announces solution a; we need to spray the skies to help cool the planet against global warming. As if activists, informed citizens and critical thinkers don’t exist, Keith makes his claims on the Colbert Report to the sarcastic reaction of both host Stephen Colbert and the crowd before walking off seemingly uncomfortably. Had we seen the last of it then or was the system planning other moves to roll geoengineering out to the general public? As the New Year began, we all knew they were not done, but no one could know for sure which direction the control system would go next. Now we know.
Now we have a clearer picture of where the agenda is going in their quest to roll out geoengineering. Ironically, it was about mid-way last year when I received an email from someone defending against one of the videos posted on my website, asking me to take it down. The person said they agreed with much of the content and videos on the site, but this one video in which an individual recorded a chemtrails pilot admitting they are spraying is attributed to Weather Modification Inc., a weather modification company as the name clearly implies. The person claimed this company is legitimate and nothing to do with the chemtrails operations.
Why is this important? Because this raises fundamental questions such as; are we to view the spraying of metal particles chemicals to manipulate the weather as a “good” chemtrails spraying? Is spraying of metal particles (including silver iodide, aluminum, barium and strontium) approved by we-the-people? Have the long term effects of spraying been examined by physicians and health experts and deemed safe? How are these spraying programs being conducted by Weather Modification Inc. different from the spraying programs we are observing every day in our skies? What else does Weather Modification Inc. do? What if all chemtrails operations can be attributed to Weather Modification Inc.? Does that give the public a reason to finally accept chemtrails as a normal operation being conducted by government good-guy contractors for your own good?
Let’s explore even deeper questions like: What public statements can Weather Modification Inc. issue regarding chemtrails planes? If what they are doing is moral and acceptable to the public, why isn’t Weather Modification Inc. upset about the chemtrails planes ruining their work? For example, if I’m a pilot with Weather Modification Inc., wouldn’t it concern me that while I’m dropping silver iodide, etc. in the atmosphere to create rain, another unmarked plane could be flying around dropping ‘other’ non-approved chemicals on the same atmosphere I’m working on. Where’s the conflict? Wouldn’t this scenario present massive problems and potential wasted money? That would actually give Weather Modification Inc. twice the reasons to protest chemtrails. After all, those planes illegally dumping chemicals are a threat to the effectiveness of Weather Modification Inc.’s work and a major threat to their reputation. If Weather Modification Inc. really believed this, wouldn’t they themselves want to track the chemtrails planes and want to file a lawsuit, criminal investigation or freedom of information act or anything to fight back against chemtrails? Is this a textbook example of compartmentalization of knowledge?
I think it is. Listening to the chemtrails pilot, it almost sounds like he genuinely doesn’t think he is doing anything wrong. It takes us back to the U.S. Air Force CHEMistry 131 manual with the ‘Chemtrails’ written all over the front. Surely most, if not all US. Air Force pilots will study this manual and not think this could be used in a bad way. If nothing else, the video above shows how they get the pilots to do the work. This is the magic of compartmentalization of knowledge.
Now in Southern California, where chemtrails operations have been at an all-time high, with chemicals being dumped at record levels into the sky every single day, we are now experiencing an engineered “catastrophic” drought. However, we know that where the ability to make rain exists the ability to stop it also exists. This is the fundamentals of weather control. This truth is being hidden from the public as Weather Modification Inc. has now been rolled out to the general public in a local news segment reporting not only the emergency drought that we are in, but the solution being delivered by Weather Modification Inc. After seeing this report, it occurred to me we’ve come full circle. Problem, Reaction, Solution. Another solution being offered to an engineered problem. Of course, we’ve known all along, this is how the control system operates.
So even though control of the weather was considered conspiracy not very long ago, now it is being put out into the public as a good thing. The history channel told us years ago, it (chemical spraying) was being used as a weapon (for creating drought and heavy rain) against potential enemies; even so, some disregarded the History Channel documentary as fiction and insisted all of this was conspiracies.(?) Now it’s being sold by local news as a solution to the current engineered west coast drought.
For a movement that has been eerily ignored, mocked and marginalized, the challenge now becomes to focus on the players that are choosing to play a role in the overt rollout of the chemical spraying crimes against humanity. Activists, informed citizens and critical thinkers need to expose these new players and claims seeking to insert their lies and deception into the hearts and minds of the masses. The same way that geoengineering front man David Keith was laughed off on the Colbert Report is the same way we, the awakened critical thinkers and concerned citizens must look to expose Weather Modification Inc. and any contractors, military or corporations who continue to work toward the agenda that involves the geoengineering of our planet. All geoengineering must stop now and we all have an obligation to demand this stops. I have never consented to inhaling nano-sized metal particles that are known to be dangerous to the human body and nature. This is exponentially worse than the dangerous vaccines the establishment is forcing on your children. This is unapproved mass genocide and human experimentation, all of which is prohibited by the ethical guidelines that apply to all experimental subjects. The first being knowledge. For any experiment to be considered ethical, the subject must have knowledge of the experiment being conducted on him/her. This knowledge has been hidden and these experiments on nature and humanity continue unapproved.
Let us never accept these lies and propaganda which have been planned in advance to usher in the rollout of geoengineering. Educate your children and keep sharing this relevant information about science, ethics, plane tracking, visual evidence and personal observational studies, and the hidden nature of the secret pseudo-science government studies that are supposed to prove that somehow ordinary emission from average planes can be emitted during normal flight and simultaneously change the weather. Think for a minute, how did the Wright Brothers miss this massive global climate altering side effect of their planes, and why didn’t this massive plane flight side effect make it to the literature and books about planes all these years? Why doesn’t anyone recall seeing lines in the sky before say 2000? Where are the childhood photos with chemtrails in the background? Did we all suffer from mass visual illusions of deep blue skies only?
This spraying agenda is very much a part of the global government plans for control admitted by the U.S. Air Force which has stated goals of controlling the weather by 2025. This control is already much more advanced and possibly in full effect now. Let’s keep the pressure on government to release the information they know about these spraying operations and let’s demand criminal investigations into those heading this agenda. Let’s keep a mental note of; Thou shalt not be fooled, in the back of our minds as we continue to fight for exposure and criminalization of all forms of unapproved unethical geoengineering.
Will we ever get our once beautiful blue skies back? Will it happen in our generation? It doesn’t seem very likely given the pace of lies, deception laced in massive compartmentalization the system is embarked on. We may not know how this will end but let us at least focus on who the players and tactics are, so we can channel our energies and efforts in the most efficient way.
Monsanto Has Purchased “Climate Corporation” For Nearly A Billion Dollars, Why?

The Monsanto/Climate Corporation Machine Of Deception
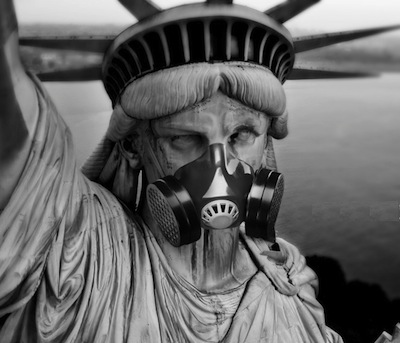
Earth’s Atmosphere As A Gas Chamber
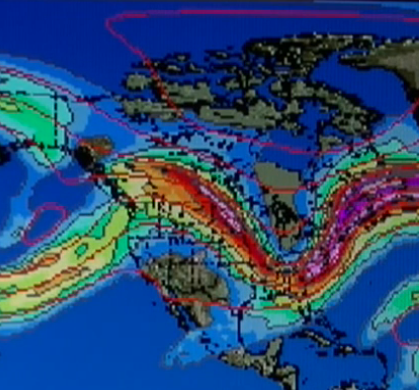
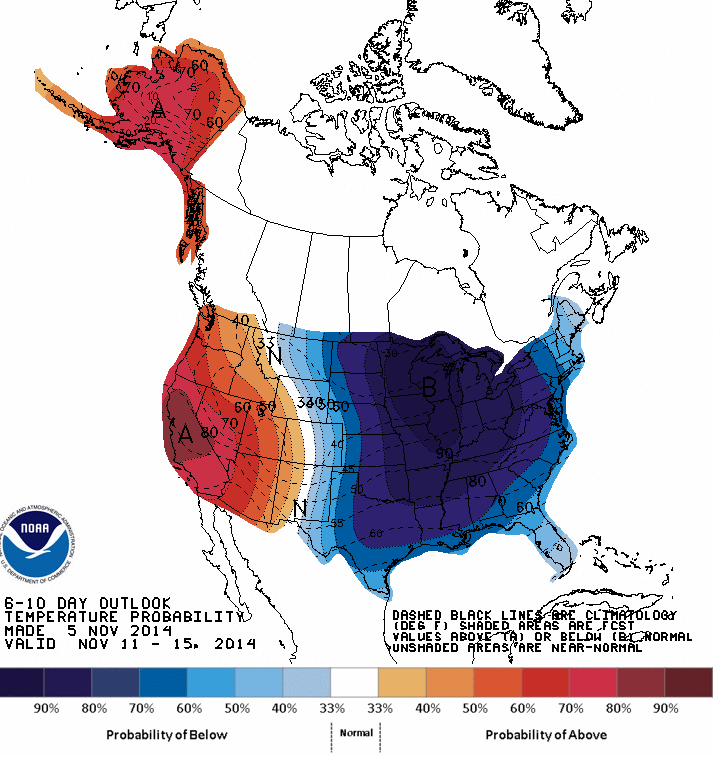
Geoengineering, Freezing The Eastern US While The Planet Fries
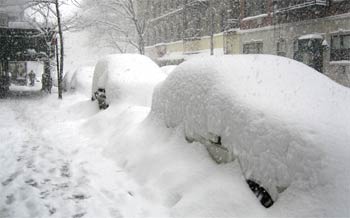
The criminal power brokers will continue to do all they can to hide the greatest crime in the history of the human race, global climate engineering. Once a critical mass of the population becomes aware of the ecocide and genocide being fueled by the climate engineering insanity, the wheels of the global elite will grind to a halt as our collective reality overturns. Those in power will do anything and everything they can to keep the public from waking up to what has been done to them, but the lump is getting too big to hide for much longer. The climate is unravelling by the day and geoengineering is speeding up this process dramatically. The engineered “cool-downs” in a few regions come at the cost of a far worsened warming overall. This is not even to mention the decimated ozone layer and a planet that is now completely contaminated even in the most remote areas. The climate engineers are doing their absolute best to keep the toxic engineered winter storms going in the Eastern US. This perpetuates the confusion and division with populations.
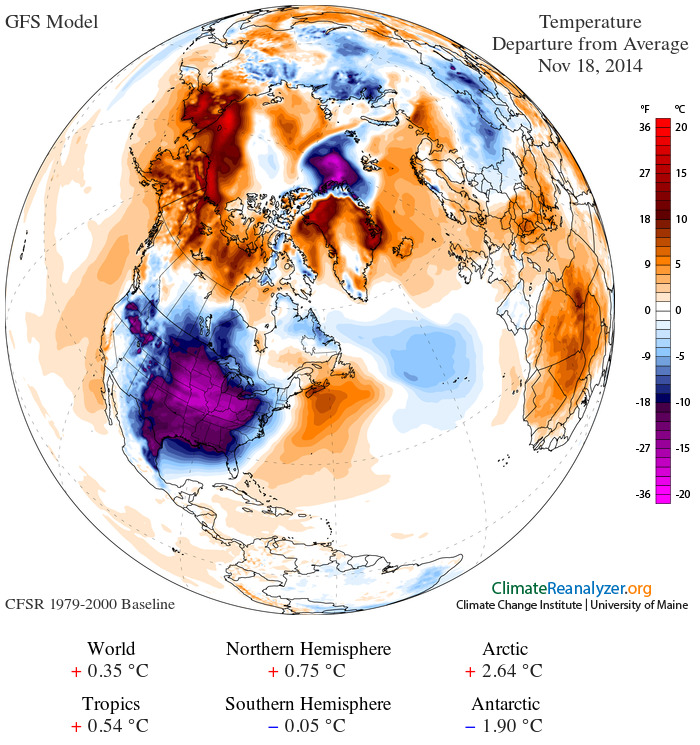
NOTE HOW ANONYMOUSLY COOL THE EASTERN US IS AS COMPARED WITH THE REST OF THE WORLD
Radical fluctuations in temperatures and weather conditions are going to continue increasing. How much longer can the bigger picture reality be hidden? Likely not much longer, our planet is descending into meltdown. If enough people get off the bench and help with the effort to expose and stop the climate engineering insanity, and if the planet is then allowed to respond on its own, there may yet be a dim light at the end of the tunnel. Lets all make our voices heard. The article below is only one of many that are now being published by the day. As always, climate engineering is not mentioned, but the reality on the ground still should not be ignored.
Dane Wigington
geoengineeringwatch.org
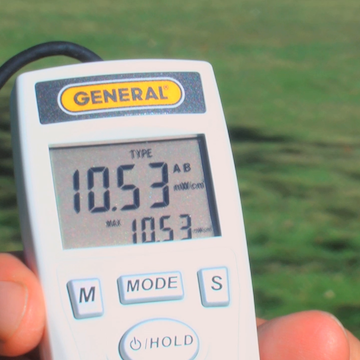
UVB Radiation Is Off The Charts, Metering Proves This Fact
Record Cold In A Record Warm World
The geoengineers are going for broke with the latest all out engineered cool-down of the US. Their Rothschild owned Weather Channel theater and its cast of actors are trumpeting the “freezing planet” headlines, but what is going on with the climate in the rest of the world? The eastern half of the lower 48 states in the US is only 1/2 of a percent of the total surface area of the planet. If that’s only 1/200th of the total surface area, whatever is happening there certainly does not reveal the bigger global picture. Unfortunately, many that live in these “engineered cool-down” zones and many who only watch the corporate controlled media have completely taken the bait. So what is the larger global picture? The just released article below will shed some light on this question. Though the publication below of course does not mention the climate engineering elephant in the room, it does give clear and verifiable facts on the bigger picture.
Dane Wigington
geoengineeringwatch.org
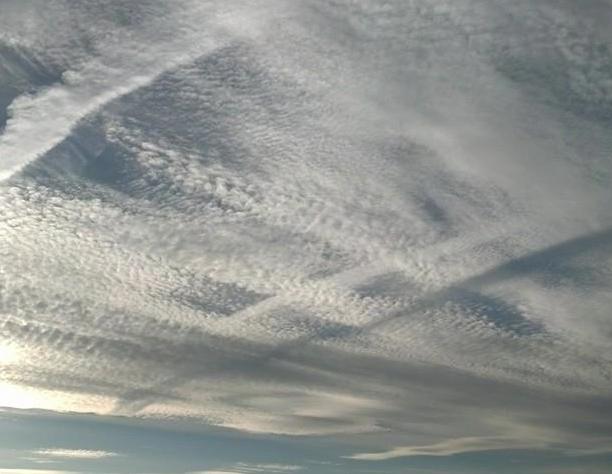
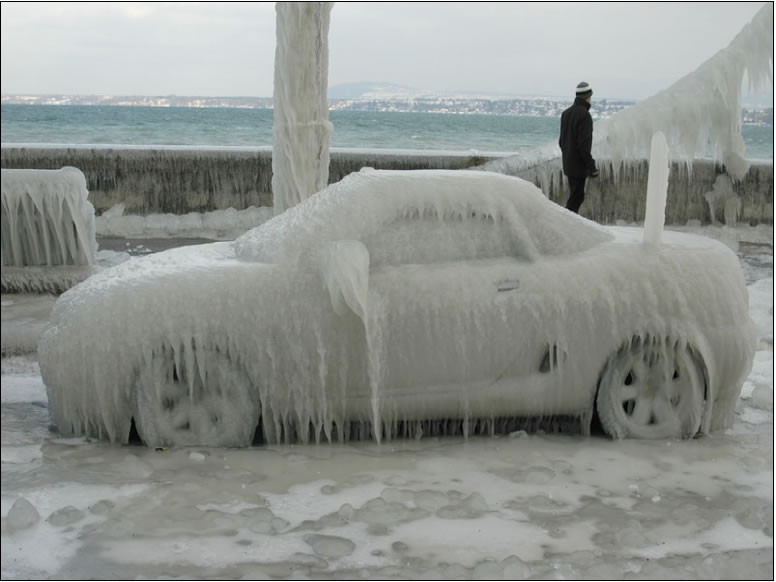
Engineered Snowstorms, What Are They Spraying?
Weather Mystery Explained By Stanford Study
Source: Nooganomics, article by David Tulis
Deindustrialization set
The news cycle this week brings attention to the global warming phenomenon that touches this local economy story, with the U.S. and Beijing agreeing to suppress coal and other means of creating air pollution. The U.S. will double the speed of its current pollution reduction trajectory, which has seen carbon dioxide emissions fall roughly 10 percent below 2005 levels to date, Scientific American says. “The country will now aim to reduce greenhouse gas emissions 26 to 28 percent below 2005 levels by 2025.” China has more coal-burning plants than the U.S., and promises to reach a pollution peak sooner rather than later.
Regular news reporting ignores the negative emissions program.
Negative emissions or sky stripes often are laid in the stratosphere here as storm fronts move in. I’ve noticed several time this year that heavy mornings of sky tattooing are followed by deep, dark storm fronts and release no rain, as if the effect of sky striping were desiccation.
Dried atmosphere, slowed gusts
A study by Stanford University funded by NASA explains that aerosol particulates floating in the air reduce rainfall and slow wind speeds. The work of managing the sun’s “heat budget” dries up rainfall.
“These aerosol particles are having an effect worldwide on the wind speeds over land; there’s a slowing down of the wind, feeding back to the rainfall too,” says civil and environmental engineering Associate Professor Mark Z. Jacobson, co-author of the study with the late Yoram J. Kaufman from NASA Goddard Space Flight Center. “We’re finding a reduction of rain, and that can lead to droughts and reduction of water supply.”
A press release from Stanford explains how a sky choking with auto fumes (and other sorts). “The accumulation of aerosol particles in the atmosphere makes clouds last longer without releasing rain. Here’s why: Atmospheric water forms deposits on naturally occurring particles, like dust, to form clouds. But if there is pollution in the atmosphere, the water has to deposit on more particles. Spread thin, the water forms smaller droplets. Smaller droplets in turn take longer to coalesce and form raindrops. In fact, rain may not ever happen, because if the clouds last longer they can end up moving to drier air zones and evaporating.”
In other words, spraying aluminum nanoparticulates above a storm system confuses it as the particles drift downward, and rain does not form, even though clouds are darkly burdened with droplets.
Stanford’s news release explains that “Aerosol particles floating in the atmosphere absorb or scatter solar radiation, and prevent it from getting to the ground.” In other words, are are right to notice our sweatless suns, and its extraordinary brilliance starting this year. I have never felt so blinded by sunlight as this year, a perception I attribute not to eyes a year older, but to atmospheric degradation from national weather policy.
Greens’ holy grails jeopardized
Why no objections to environmental modification from the green lobby? Its members should notice that reduced sunlight and wind damage solar panel absorption and wind farm turbine RPMs. In California, Dr. Jacobson estimates, wind speeds are 8 percent slower with its high levels of air pollution (in a state with one of the toughest anti-pollution regimes in the U.S.). “Slower gusts may reduce wind’s economic competitiveness compared to other energy sources, such as fossil fuels,” the Stanford report notes.
“Slow winds may hinder development of wind power in China, where it’s a needed alternative to dirty coal-fired plants. Aerosols’ reduction of the wind also may explain the reduction in the Asian seasonal monsoon and “disappearing winds” in China, observations found in other studies. Moreover, slack air currents may hurt energy efficiency in Europe, where countries like Denmark and Germany have made major wind-power investments.
“Slower winds evaporate less water from oceans, rivers and lakes. Furthermore, the cooling of the ground provoked by the aerosol particles reduces the evaporation of soil water.
Our interest in local economy, self-determination, intelligent and personal commerce, the return of a decentralized political and economic order under the rule of law seems thwarted at every turn. At least in appearance. It seems as though federal intervention in everything from schooling to the good people’s vacuous medium of exchange makes local economy an impossible, fruity concept. To contemplate sky striping makes the ideals of local economy seem even more remote.
‡ In an essay of Prof. Michael Chossudovsky’s website Global Research (Globalresearch.ca), Amy Worthington, in “Aerosol and Electromagnetic Weapons In The Age Of Nuclear War,” June 1, 2004, describes the lofty U.S. cloud injection program as “sunscreen” to make the skies electrically conductive, a plasma suitable for radar and radio wave transmission, a context for the generation and use of long-term extremely low frequency electromagnetic energy, global in scope. http://globalresearch.ca/articles/WOR406A.html
Maria José Viñas , “Aerosol pollution slows winds, reduces rainfall,” Stanford University News Service, Jan. 24, 2007. http://news.stanford.edu/news/2007/january24/slowwind-012407.html
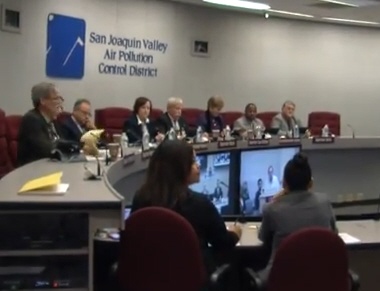
GeoEngineering Cover Up Exposed: SJV Air Pollution Control Board Limits Public Comment To 12 Minutes
“Net Neutrality”, Save the Internet Campaign: A Common Carrier Free from Corporate Encroachment

Source: Global Research
This week has been a turning point in a seven month campaign to Save the Internet. The campaign began when FCC Chair, Tom Wheeler, told the media in May that he was considering creating a tiered Internet where wealthy corporations could pay for faster service giving them an advantage over start-ups, small businesses, entrepreneurs and citizen activists.
Model shows West Coast completely blacked out due to particles covering area — Gundersen: Lung cancers to start increasing in Pacific Northwest
US Nuclear Professor: Fukushima “a really major event here”, Washington had radioactive aerosols 100,000 times normal; “Far more bigger accident than we’re hearing” — Model shows West Coast completely blacked out due to particles covering area — Gundersen: Lung cancers to start increasing in Pacific Northwest (AUDIO)
Source: Energy News
Warmer In The Arctic Than In Texas? What Is Wrong With This Picture?
It’s Warmer In Alaska Than In Texas Right Now
Source: Chron
That’s according to the National Weather Service, which reported highs in the lower 30s Fahrenheit for Barrow, AK — the northernmost city in the country — but only in forecasted highs in the low 20s for Amarillo, TX.
The Post-Tribune And The Geoengineering Elephant In The Room
Davich: Contrails, chemtrails or contemporary legend?
Source: Post-Tribune, News of Northwest Indiana, article by Jerry Davich
Look, up in the sky. No, seriously.
There’s a possibility you’ll see intriguing white streaks of, well, something.
Are they simply contrails from jet airplane engines, which have been leaving exhaust-related plumes for decades? Or are these murky streaks something more?
Possibly “geo-engineering” at work or chemical trails (“chemtrails”)? Or more radical explanations, such as human pesticides, biological agents and weather pattern manipulation, as I’ve been told by critical observers. Conspiracy theories, you say?
“Conspiracy possibilities,” replied Andrew Reed of Chesterton.
“I’ve seen contrails. These are different,” he insisted, pointing to a ton of Internet information and conjecture on this topic.
“I’ve studied chemtrails for a while now, but this was the first time I saw them happen for myself,” he told me earlier this week. “My experience today helped solidify my beliefs that planes are dropping something on an unsuspecting public.”
On that day, our Northwest Indiana skies were littered with these cloudy white streaks going every direction. I always assumed they were created by jets flying to and from the two Chicago airports. Not so, claims Reed and others.
“The planes were crisscrossing and making 90-degree turns right before my eyes,” said Reed, a sanitation worker for Portage. “The trails they left acted in accordance with everything I have come to know about them. They left a murky cloud-like haze that did not evaporate. They are real and shrouded in mystery.”
Mystery indeed, until you talk with a university chemistry professor or meteorologist from The Weather Channel.
“There is a very basic scientific explanation for these chemtrails,” said Kory Stiffler, a visiting assistant professor of chemistry, physics and astronomy at Indiana University Northwest in Gary. “They are essentially trails of water vapor left by the exhaust of airplanes, which condense in the cold air and form little trails of clouds, the same way a regular cloud is formed.”
The reason these water vapor trails (and clouds) are white is that the water vapor of which they are composed scatters sunlight in all directions, he noted. On the other hand, the scattering of sunlight by atmospheric gases (primarily nitrogen and oxygen) is the reason the sky is blue — these gases scatter blue light in all directions.
It’s all Physics 101, a course he teaches every semester.
Meteorologists from The Weather Channel agree, telling me that when weather conditions are just right, jets leave behind a streaming contrail cloud.
“Some conspiracy theorists believe these are trails of chemicals released by planes. However, that is not the case,” a Weather Channel spokeswoman told me.
In simplest terms, such conditions need a rather high relative humidity but below the point of saturation, with no clouds. A slight change in air temperature can lead to this condensation.
“Relative humidity is when temperature and dew point are close together,” the spokeswoman said. “When the temperature drops to the dew point, this is when you get the condensation or clouds, or contrail in this case.”
Reed and other critics of such scientific explanation don’t believe it.
“Why do people refuse to believe that geoengineering is real?” asked Reed, who took a photo of the sky that day, which accompanies this column. “We’ve seen what governments can do, with cases like Agent Orange in Vietnam and other instances of chemical warfare.”
Reed is certainly not alone with such thinking locally. I’ve heard from many other readers about these contrails or chemtrails, especially this past year.
“They were spraying big time today. It can’t be good,” said Jerry Gilles, a social media follower.
“They’ve been doing it for years but people are finally starting to realize what’s happening,” said Kathy Parsons of Gary.
Many of them insist doubters watch the 2010 documentary film, “What in the World Are They Spraying?” which reportedly reveals the chemtrail-geoengineering cover-up.
This is how it’s billed: “Here is the story of a rapidly developing industry called geo-engineering, driven by scientists, corporations, and governments intent on changing global climate, controlling the weather, and altering the chemical composition of soil and water — all supposedly for the betterment of mankind.” But, “the effect has been devastating to crops, wildlife and human health. We are being sprayed with toxic substances without our consent.”
Reed, among others, is a believer.
“I believe it’s aluminum and possibly barium and strontium,” he said.
Why?
“Possibly to block solar rays to slow global warming,” he said. “Possibly to experiment on the population. To destroy plant life. To destroy soil on independent farms for big agriculture interests. Weather manipulation. There are numerous possibilities.”
Really?
“People can make all the tinfoil hat jokes they want, but I’m scared,” Reed said. “I don’t live my life based on fear, but this is so strange.”
From a sociological perspective, this is called a “contemporary legend,” contrary to an urban legend, used to differentiate modern legend from traditional folklore in preindustrial societies.
This type of legend reflects contemporary circumstances and paranoia about unseen enemies and threats to our country, such as “enemy agents,” “big government” or “big brother.”
As the sociologist W.I. Thomas taught us, “What people define as real becomes real in their consequences.” Even though the stories may not be real at all.
“Remember, it doesn’t mean these contemporary legends are real but simply that people believe them to be true and what such beliefs say about urban life and perhaps even history,” said Charles Gallmeier, professor of sociology at IUN.
Again, I tell you, look up in the sky. But also look in your psyche and your gut before coming to your conclusion.
Source: Post-Tribune, News of Northwest Indiana, article by Jerry Davich
Record High Temperatures In The Arctic While The Eastern US Freezes
Temperatures in the Arctic as high as 50 degrees while the mercury is nearly 30 below at some locations in the Eastern US, what is wrong with this picture?
Climate engineering is tearing the biosphere’s life support systems apart. The geoengineering elephant in the room continues to wreak havoc on the planet while the entire climate science community pretends not to know a thing about the climate engineering insanity. All are needed to help sound the alarm by passing out credible data to those that still have no clue about what is going on in our skies. Start “spot fires” of awareness everywhere you can, every day counts.Taking a daily compass heading of data from multiple sources is imperative for reaching solid conclusions on exactly what is unfolding. We must all work together, everything depends on our unity in this battle. The article below does not mention climate engineering as is to be expected, but it does make clear the unprecedented conditions that are occurring.
Dane Wigington
geoengineeringwatch.org
U.S. is turning into an icebox this week. The record temps to prove it
Source: Mashable
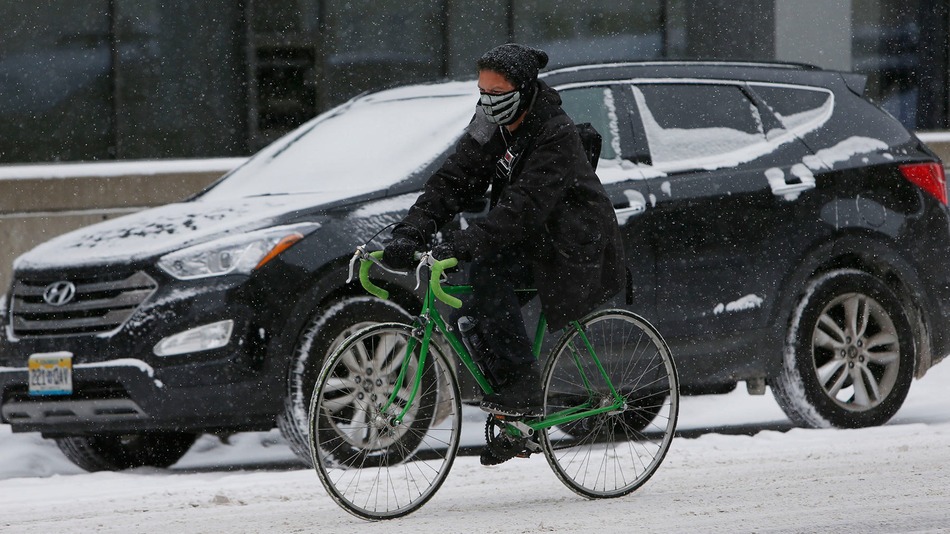
A bicyclist is bundled up to deal with the elements while riding hrough downtown Denver, Wednesday, Nov. 12, 2014.
An extreme weather pattern that began with a super typhoon in the Pacific Ocean is now gripping half of the United States with record-smashing cold. Essentially, the U.S. — from the Mid-Atlantic to the Gulf Coast, northward to the Canadian border, and all the way west to Portland, Oregon — has turned into an icebox.
At the same time, record warmth has surged into Alaska and Northwest Canada, as the upper level weather highway known as the jet stream is diverted at least a thousand miles north of its usual position at this time of year, before plunging so far south over the U.S. that the air in Illinois is being sourced straight from Siberia.
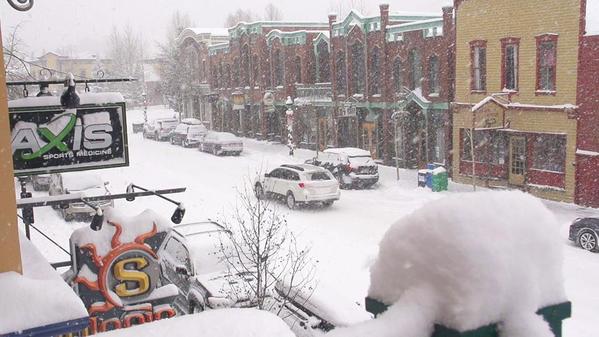
Snowy scene in Breckenridge! Two days until opening day and MORE snow is on the way.
Here are some of the most noteworthy weather records set over the past few days. We’ll see more over the course of the next week, as at least one (perhaps two) more rounds of Arctic air invade the U.S. from our neighbor to the north.
- Minus-14 degrees Fahrenheit: In Denver, the temperature dropped to minus-14 degrees Fahrenheit on Thursday morning, tying for the second coldest all-time temperature recorded there in the month of November. The last time this happened was Nov. 27, 1887; the all-time record low there is minus-18 degrees Fahrenheit, set in 1877. The high temperature at Denver International Airport only reached 6 degrees Fahrenheit on Nov. 12, a record low maximum temperature for the date, beating the old record of 9 degrees, which was set in 1916.
Robert Henson, a meteorologist at the University Corporation for Atmospheric Research in Boulder, Colo., posted on Facebook that in Denver’s recorded history of 142 Novembers, the only November days colder than Wednesday were in 1880 and 1919. Denver may see the first-ever streak of three November days with a high temperature below 20 degrees Fahrenheit, Henson added.
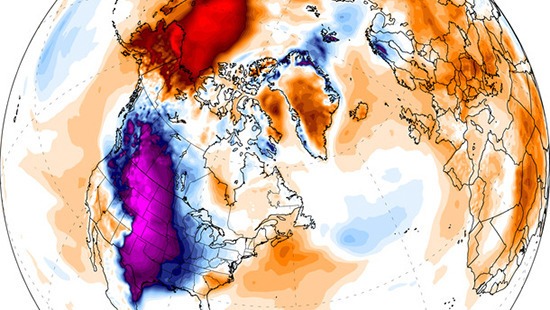
Temperature departures from average for Nov. 12, 2014, showing the unusual cold across the lower 48 states and unusually mild weather in Alaska and the Arctic.
- Minus-27 degrees Fahrenheit: In Casper, Wyoming, the extremely low temperature on Wednesday evening set a daily record low as well as a monthly low. This beat the previous monthly record low of minus-21 degrees Fahrenheit, set on Nov. 23, 1985. These temperatures are about 50 degrees Fahrenheit below average for this time of year, and cold weather of this magnitude is typically experienced there beginning in December (if at all). The earliest Wyoming had reached such a cold temperature was on Dec. 5, 1972, the National Weather Service said. Climate data there dates back to 1939.
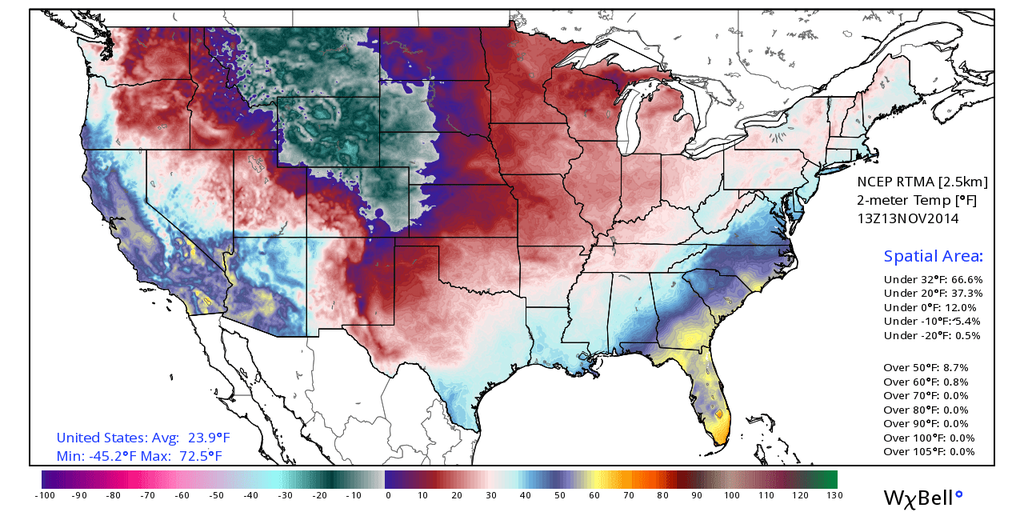
U.S. temperatures on Nov. 13, 2014, showing the core of the cold air parked over the Northwest Rockies, but spilling east and west to cover most of the country.
- Minus-21 degrees Fahrenheit: It was Livingston, Montana’s coldest temperature for so early in the season on Nov. 12. However, it has previously been much colder than this in November, with a reading of minus-31 degrees Fahrenheit on Nov. 13, 1959.
- 21 degrees Fahrenheit: On Nov. 12, Amarillo, Texas, set its coldest daily high temperature on record for so early in the season.
- 14 degrees Fahrenheit: On Nov. 12, Goodland, Kansas, set a record for the coldest daily high temperature for so early in the season.
- As the frigid airmass blows across the relatively warm waters of the Great Lakes, we’re likely going to see prodigious amounts of lake effect snow during the next week. As the Weather Prediction Center (WPC) put it in a forecast discussion on Thursday morning:
A VERY PROLONGED PERIOD OF LOCAL LAKE-EFFECT SNOWFALL EVENTS WILL PREVAIL AT VARIOUS TIMES ACROSS ALL 5 GREAT LAKES. WITH SIGNIFICANT SNOWS ALREADY PRESENT…HARD TO IMAGINE HOW MUCH MORE SNOWFALL IS POSSIBLE…PROLIFIC? NUMBERS ARE POSSIBLE. ANOMALOUS? CERTAINLY.
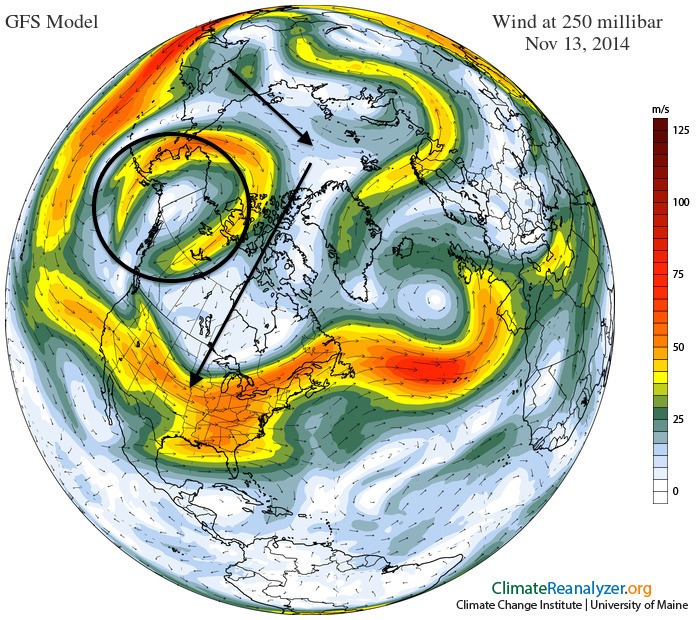
Map of the jet stream on Nov. 13, 2014, with an oval around the major dome of high pressure over Alaska, and arrows showing the frigid air being routed over the North Pole and into the lower 48 states.
The warm side of this weather pattern:
- 50 degrees Fahrenheit: A record high temperature was set in King Salmon, Alaska, on Nov. 12. This beats the old record of 48 degrees Fahrenheit in 1986. The typical high temperature in King Salmon at this time of year is 31 degrees Fahrenheit.
- At least 41 degrees Fahrenheit: On Thursday, McGrath, Alaska, had already set a daily high temperature record as of 4:49 a.m. local time, at 41 degrees Fahrenheit. The actual high temperature will climb further during the day. McGrath will likely also set a record high minimum temperature record of 38 degrees Fahrenheit, which breaks the old record of 30 degrees from 2000.
- The cold air is going to spread all the way to the West Coast as well as the Southwest U.S. with time, and it will ooze into the Southeast, including Florida, as well, according to the WPC. Some models are suggesting that a snow event may take shape along the East Coast next week, but there is a lot of uncertainty regarding that scenario.The weather pattern is leading to a classic episode of what climate scientists have labeled the “warm Arctic, cold continents” pattern, something that has been seen with increasing frequency in recent years. Studies have tied this particular pattern in part to rapid Arctic climate change as a result of manmade global warming, although this is still a subject of debate within the mainstream climate science community.
Source: Mashable
Global Extinction within one Human Lifetime as a Result of a Spreading Atmospheric Arctic Methane Heat wave and Surface Firestorm
Source: RobinWestenra @ Blogspot
Abstract
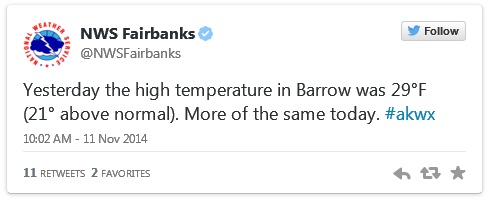
Although the sudden high rate Arctic methane increase at Svalbard in late 2010 data set applies to only a short time interval, similar sudden methane concentration peaks also occur at Barrow point and the effects of a major methane build-up has been observed using all the major scientific observation systems. Giant fountains/torches/plumes of methane entering the atmosphere up to 1 km across have been seen on the East Siberian Shelf. This methane eruption data is so consistent and aerially extensive that when combined with methane gas warming potentials, Permian extinction event temperatures and methane lifetime data it paints a frightening picture of the beginning of the now uncontrollable global warming induced destabilization of the subsea Arctic methane hydrates on the shelf and slope which started in late 2010. This process of methane release will accelerate exponentially, release huge quantities of methane into the atmosphere and lead to the demise of all life on earth before the middle of this century.
Introduction
The 1990 global atmospheric mean temperature is assumed to be 14.49 oC (Shakil, 2005; NASA, 2002; DATAWeb, 2012) which sets the 2 oC anomaly above which humanity will lose control of her ability to limit the effects of global warming on major climatic and environmental systems at 16.49 oC (IPCC, 2007). The major Permian extinction event temperature is 80 oF (26.66 oC) which is a temperature anomaly of 12.1766 oC above the 1990 global mean temperature of 14.49 oC (Wignall, 2009; Shakil, 2005).
Results of Investigation
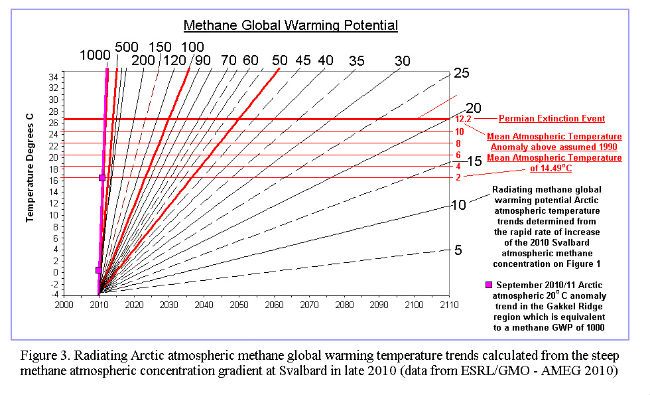
Figure 1 shows a huge sudden atmospheric spike like increase in the concentration of atmospheric methane at Svalbard north of Norway in the Arctic reaching 2040 ppb (2.04 ppm)(ESRL/GMO, 2010 – Arctic – Methane – Emergency – Group.org). The cause of this sudden anomalous increase in the concentration of atmospheric methane at Svalbard has been seen on the East Siberian Arctic Shelf where a recent Russian – U.S. expedition has found widespread, continuous powerful methane seepages into the atmosphere from the subsea methane hydrates with the methane plumes (fountains or torches) up to 1 km across producing an atmospheric methane concentration 100 times higher than normal (Connor, 2011). Such high methane concentrations could produce local temperature anomalies of more than 50 oC at a conservative methane warming potential of 25.
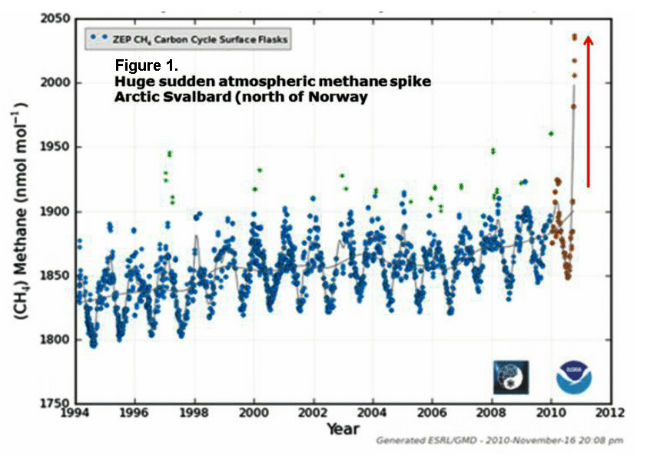
Figure 2 is derived from the Svalbard data in Figure 1 and the methane concentration data has been used to generate a Svalbard atmospheric temperature anomaly trend using a methane warming potential of 43.5 as an example. The huge sudden anomalous spike in atmospheric methane concentration in mid August, 2010 at Svalbard is clearly evident and the methane concentrations within this spike have been used to construct a series of radiating methane global warming temperature trends for the entire range of methane global warming potentials in Figure 3 from an assumed mean start temperature of -3.575 degrees Centigrade for Svalbard (see Figure 2) (Norwegian Polar Institute; 2011).
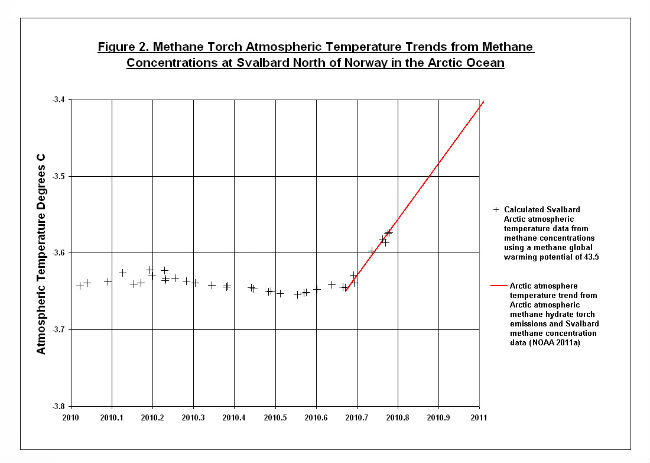
Figure 3 shows a set of radiating Arctic atmospheric methane global warming temperature trends calculated from the steep methane atmospheric concentration gradient at Svalbard in 2010 (ESRL/GMO, 2010 – Arctic-Methane-Emergency-Group.org). The range of extinction temperature anomalies above the assumed 1990 mean atmospheric temperature of 14.49 oC (Shakil, 2005) are also shown on this diagram as well as the 80 oF (26.66 oC) major Permian extinction event temperature (Wignall, 2009).
Sam Carana (pers. com. 7 Jan, 2012) has described large December 2011 (ESRL-NOAA data) warming anomalies which exceed 10 to 20 degrees centigrade and cover vast areas of the Arctic at times. In the centres of these regions, which appear to overlap the Gakkel Ridge and its bounding basins, the temperature anomalies may exceed 20 degrees centigrade. The temperature anomalies in this region of the Arctic for the period from September 8 2011 to October 7, 2011 were only about 4 degrees Centigrade above normal (Carana, pers. com. 2012). This data set can be seen on this site:- http://arctic-news.blogspot.com/p/arctic-temperatures.html
Because the Svalbard methane concentration data suggests that the major spike in methane emissions began in late 2010 it has been assumed for calculation purposes that the 2010 temperature anomalies peaked at 4 degrees Centigrade and the 2011 anomalies at 20 degrees Centigrade in the Gakkel Ridge region. The assumed 20 degree Centigrade temperature anomaly trend from 2010 to 2011 in the Gakkel Ridge region requires a methane gas warming potential of about 1000 to generate it from the Svalbard methane atmospheric concentration spike data in 2010. Such high methane warming potentials could only be active over a very short time interval (less than 5.7 months) as shown when the long methane global warming potential lifetimes data from the IPCC (2007; 1992) and Dessus, Laponte and Treut (2008 ) are used to generate a global warming potential growth curve with a methane global warming potential of 100 with a lifespan of 5 years.
Because of the high methane global warming potential (1000) of the 2011, 20 oC temperature anomalies in the Gakkel Ridge region, the entire methane global warming potential range from 5 to 1000 has been used to construct the radiating set of temperature trends shown in Figure 3. The 50, 100, 500 and 1000 methane global warming potential (GWP) trends are red and in bold. The choice of a high temperature methane peak with a global warming potential near 1000 is in fact very conservative because the 16 oC increase is assumed to occur over a year. The observed ESRL-NOAA Arctic temperature anomalies varied from 4 to 20 degrees over less than a month in 2011 (Sam Carana, pers. comm. 2012).
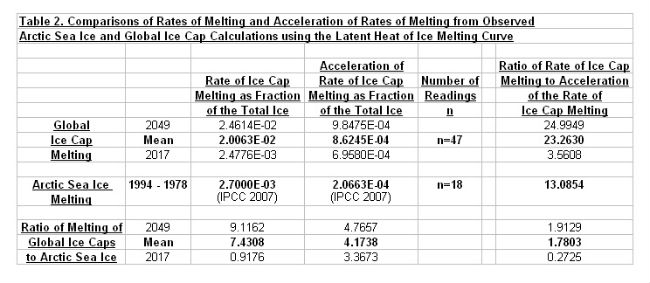
Figure 4 shows the estimated lifetime of a globally spreading Arctic methane atmospheric veil for different methane global warming potentials with the minimum, mean and maximum lifetimes fixed with data from Dessus, Laponche and Treut (2008) and IPCC (2007, 1992). On this diagram it is evident that the maximum methane global warming potential temperature trend of 50 intersects the 2 degree centigrade temperature anomaly line in mid 2027 at which time humanity will completely lose our ability to combat the earth atmospheric temperature rise. This diagram also indicates that methane will be an extremely active global warming agent for the first 15 years during the early stages of the extinction process. At the 80 o F (26.66 oC) Permian extinction event temperature line (Wignall, 2009), which has a 12.177 oC temperature anomaly above the 1980 mean of 14.49 oC, the lifetime of the minimum methane global warming potential veil is now some 75 years long and the temperature so high that total extinction of all life on earth will have occured by this time.
The life time from the almost instantaneous injection of methane into the atmosphere in 2010 is also shown as the two vertical violet lines (12 +- 3) years and this has been extended by 6 percent to 15.9 years to take account of increased methane concentrations in the future (IPCC, 1992b). This data set can be used to set up the likely start position for the extinction event from the large methane emissions in 2010.
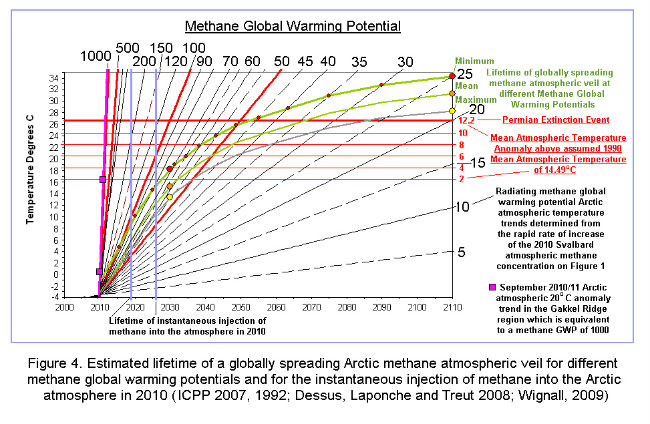
Figure 5 shows the estimated Arctic Gakkel Ridge earthquake frequency temperature increase curve (Light, 2011), the Giss Arctic mean November surface temperature increase curve (data from Carana, 2011) and the mean global temperature increase curve from IPCC (2007) long term gradient data. The corrected Arctic atmospheric temperature curve for the ice cap melt back in 2015 was derived from the mean time difference between the IPCC model ice cap and observed Arctic Ice cap rate of volume decrease (Masters, 2009). The ice cap temperature increase curve lags behind the Arctic atmosphere temperature curve because of the extra energy required for the latent heat of melting of the permafrost and Greenland ice caps (Lide and Frederickse, 1995).
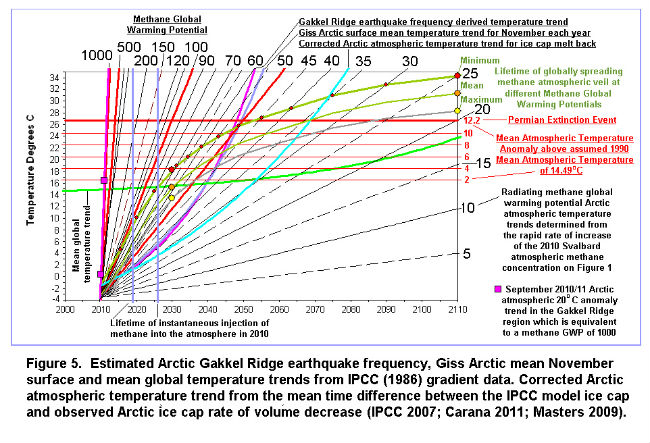
Figure 6 shows 5 mathematically and visually determined best estimates of the possible global atmospheric extinction gradients for the minimum (a), mean (b) and maximum (e) methane global warming potential lifetime trends. The mean (c) methane global warming potential lifetime trend has almost the identical gradient to the best mathematical fit over the temperature extinction interval (2 oC to 12.2 oC temperature anomaly zone) as the Arctic Gakkel Ridge frequency data (b) and the Giss Arctic mean November surface temperature data (d). This suggests that the Giss Arctic mean November surface temperature curve and the Arctic Gakkel Ridge frequency temperature curves are good estimates of the global extinction temperature gradient.
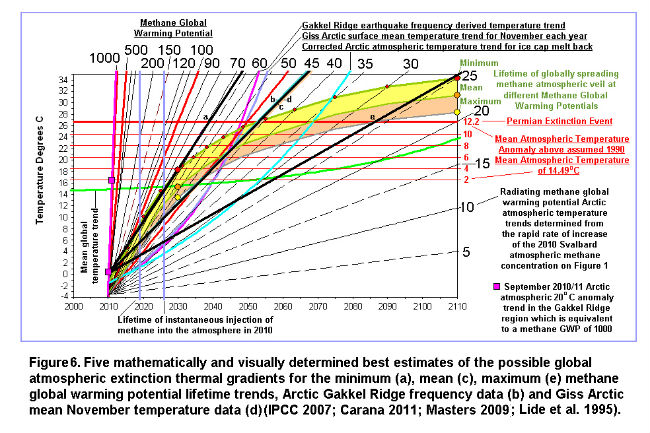
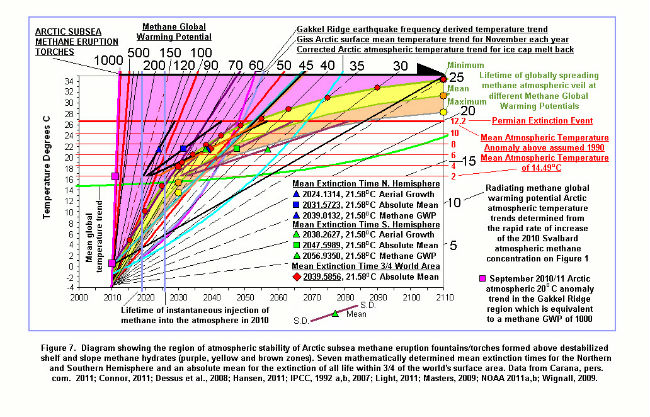
Figure 7 diagramatically shows the funnel shaped region in purple, yellow and brown of atmospheric stability of methane derived from Arctic subsea methane eruption fountains/torches formed above destabilized shelf and slope methane hydrates (Connor, 2011). The width of this zone expands exponentially from 2010 with increasing temperature to reach a lifetime of more than 75 years at 80 o F (26.66 oC) which is the estimated mean atmospheric temperature of the major Permian extinction event (Wignall 2009). The previous most catastrophic mass extinction event occured in the Permian when atmospheric methane released from methane hydrates was the primary driver of the massive mean atmospheric temperature increase to 80 oF (26.66 oC) at a time when the atmospheric carbon dioxide was less than at present (Wignall, 2009).
Method of Analysis
By combining fractional amounts of an assumed standard Arctic methane fountain/torch/plume with a global warming potential of 1000 (which equals a 16 oC temperature rise (4 – 20 oC) over one year – 2010 – 2011) with the mean global temperature curve (from IPCC 2007 – gradient data) it was possible to closely match the 5 visually and mathematically determined best estimates of the global extinction gradients shown in Figure 6 (a to e). Because the thermal radiant flux from the earth into space is a function of its area (Lide and Fredrickse, 1995) we can roughly determine how many years it will take for the methane to spread globally by getting the ratio of the determined fraction of the mean global temperature curve to the fraction of the Arctic methane fountain/torch/plume curve, as the latter is assumed to represent only one year of methane emissions. In addition as the earth’s surface area is some 5.1*10^8 square kilometres (Lide and Fredrickse, 1995) a rough estimate of the average area of the region over which the methane emissions occur within the Arctic can also be determined by multiplying the Arctic methane/torch/plume fraction by the surface area of the earth. The Arctic fountain/torch areas are expressed as the diameter of circular region of methane emissions or the two axes A and B of an ellipse shaped area of methane emissions (where B = 4A) (Table 1)
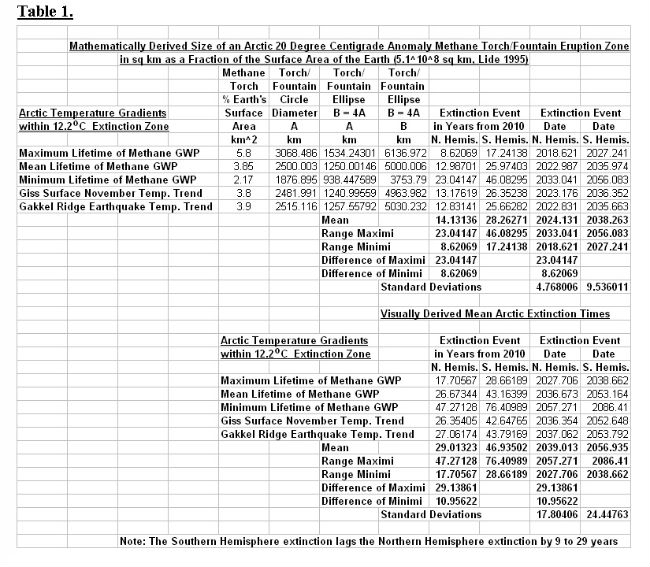
Twenty estimates have been made of the times of the various extinction events in the northern and southern hemispheres and these are shown on Table 1 and summarised on Figure 7 with their ranges. The absolute mean extinction time for the northern hemisphere is 2031.8 and for the southern hemisphere 2047.6 with a final mean extinction time for 3/4 of the earth’s surface of 2039.6 which is similar to the extinction time suggested previously from correlations between planetary orbital mechanics and the frequency increase of Great and Normal earthquake activity on Earth (Light, 2011). Extinction in the southern hemisphere lags the northern hemisphere by 9 to 29 years.
Figure 8 shows a different method of interpreting the extinction fields defined by the (12 +-3) + 6% year long lifetime of methane (IPCC, 1992) assumed to have been instantaneously injected into the Arctic atmosphere in 2010 and the lifetime of the globally spreading methane atmospheric veil at different methane global warming potentials. The start of extinction begins between 2020 and 2026.9 and extinction will be complete in the northern hemisphere by 2057. Extinction will begin around 2024 in the southern hemisphere and will be completed by 2087. Extinction in the southern hemisphere, in particular in Antarctica will be delayed by some 30 years. This makes property on the Transantarctic mountains of premium value for those people wish to survive the coming methane firestorm for a few decades longer..
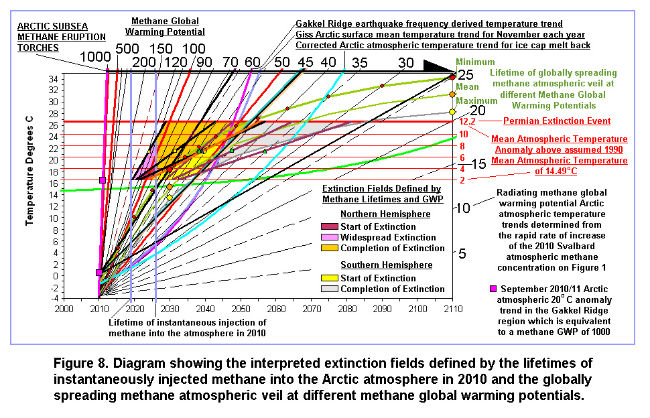
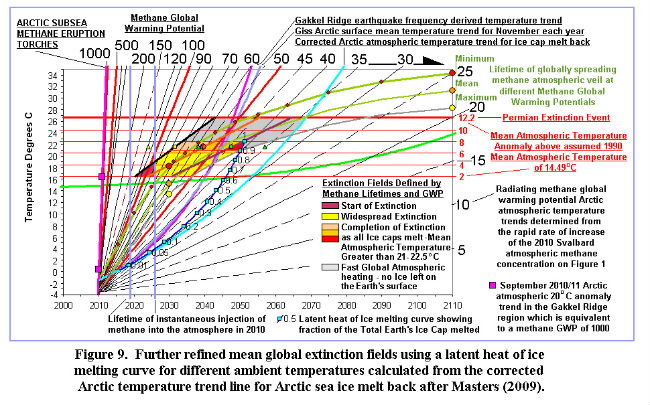
Figure 9. is a further refinement of the extinction fields shown in Figure 8. by defining a new latent heat of ice melting curve at different ambient temperatures which has been calculated from the corrected Arctic atmospheric temperature trend for the ice cap melt back defined by the difference between the Piomass observed melt back time and the IPCC modelled melt back time which predicts the melt back incorrectly some 50 years into the future (Masters, 2009). This work shows that the IPCC climate models are probably more than 100 years out in their prediction of the complete melting of the Greenland and Antarctic ice caps.
Method of Analysis
To melt 1 kg of ice you require 334 kilo Joules of energy (the latent heat of melting of ice) to transform the solid into the liquid at 0 oC (Wikipedia, 2012 ).
Subsequently for each one oC temperature rise, the water requires and additional 4.18 kilo Joules to heat it up to the ambient temperature (Wikipedia, 2012). An 80 oC temperature rise of a 1 kg mass of water requires almost exactly the same amount of energy input (334.4 kJ) as the amount of energy required by the latent heat of melting of ice (334 kJ) to covert one kg of ice into water at 0 oC. Because one Joule is the energy equivalent of the power of one watt sustained for one second there is also a time element in the melting of the ice and the heating up of the water, i.e. it is the function of temperature increase and the time similar to the way oil is generated in sediments (Lopatin, 1971; Allen and Allen, 1990).
If we consider the time necessary to melt one kg of ice and then raise its temperature to 80 oC, both of the above processes require the same amount of energy so we can consider that the first half of the time will simply involve conversion the solid ice into a liquid state at 0 oC and the second half of the time in heating the resulting ice water from 0 to 80 oC. This means that the ice melt curve at 80 oC will lag the atmospheric temperature line by half the time at 80 oC.
For temperatures less than 80 oC, the energy necessary to raise the water formed from the melted ice to the ambient temperature is less than that required for the latent melting of the ice (required to move it from a solid to a liquid state) and progressively more relative energy is needed at low temperatures to melt the ice.
The following formulation has been used to calculate the ratio of the time necessary for the melting of 1 kg of ice to water a 0 oC to the time necessary for the heating up of the 1 kg of water produced from the melted ice to the specified ambient temperature.
For any power n, let 2^n represent the ambient temperature of 1 kg of water which was derived from the melting of 1 kg of ice.
The energy required for the original melting of the 1 kg ice to water at 0 oC (latent heat of melting of ice) = 2^(n-3)/10 = 2^n/(2^3*10) = 2^n/80 = ambient temperature/80
Examples;
Let n=1; therefore temperature = 2^1 = 2 oC
Latent heat of melting = 2^(n-3)/10 = 2^-2/10 = 1/10*1/(2^2) =1/10*1/4 = 1/40
Let n=5; therefore temperature = 2^5 = 32 oC
Latent heat of melting = 2^(n-3)/10 = 2^2/10 = 4/10
The ratio of the time required for the latent heat of melting at any temperature is the reciprocal of the above = 10/(2^n-3)
The total time is therefore
a.) The time necessary for the latent heat of melting to covert 1 kg of ice into water
at 0 oC = 10/(2^n-3)
and:-
b.) The time required to heat up the 1 kg of water up to a temperature of 2^n = 1.
The total time = (10/(2^n-3)+1)
Therefore the fraction of time needed to simply melt the ice to 0 oC before it is raised to the ambient temperature 2^n = 10/(2^n-3)/((10/(2^n-3))+1)
Now: ((10/(2^n-3)) +1) = (10+ (2^n-3))/(2^(n-3))
The total time is therefore = 10/(10+(2^n-3))
Examples showing the calculation of the time ratio of the energy of latent heat of melting of ice to form water at 0 oC to the energy necessary to raise the water to the ambient temperature are shown below:-
N 2^n oC Fraction Formula Fraction
0 1 10/(10+1/8) 0.9877
1 2 10/(10+1/4) 0.9756
2 4 10/(10+1/2) 0.9526
3 8 10/(10+1) 0.9091
4 16 10/(10+2) 0.8333
5 32 10/(10+4) 0.7143
6 64 10/(10+8) 0.5555
6.32193 80 10/(10+10) 0.5000
The time value at each temperature of the corrected Arctic atmospheric temperature trend from the observed ice cap melt back (Masters, 2009) has been multiplied by the above fraction for each ambient temperature to determine a new “latent heat of ice melting curve” which represents the temperature – time energy necessary for the complete melting of the ice to water at 0 oC without the additional energy needed to raise the water to the ambient temperature of the atmosphere. This latent heat of ice melting curve is shown as the dark blue line on Figure 9.
The maximum mean global atmospheric temperature above which all the world’s icecaps will have completely melted away is estimated to lie between 7 oC and 8 oC above the mean global temperature which here is taken as 14.49 oC in 1990 (IPCC, 2007). The critical temperatures above which the Earth will entirely lose its ice caps are between 21.49 oC and 22.49 oC. It has been found however that the latent heat of ice melting curve first intersects the maximum lifetime stability line for atmospheric methane calculated from the methane global warming potentials (see. Figure 3) at the 20.964 oC extinction line (6.474 degrees centigrade above the atmospheric mean temperature of 14.49 oC in 1980) at 2050.1 and the 22.49 oCextinction line (8 oC above the atmospheric mean temperature of 14.49 oC in 1980) at 2051.3. Therefore the limits of the final melting and loss of all ice on Earth have been fixed between the 6.474 oC and 8 oC anomalies above the 1990 mean atmospheric temperature of 14.49 oC. This very narrow temperature range includes all the mathematically and visually determined extinction times and their means for the northern and southern hemispheres which were calculated quite separately (Figure 7; Table 1).
Once the world’s ice caps have completely melted away at temperatures above 22.49 oC and times later than 2051.3, the Earth’s atmosphere will heat up at an extremely fast rate to reach the Permian extinction event temperature of 80oF (26.66 oC)(Wignall, 2009) by which time all life on Earth will have been completely extinguished.
The position where the latent heat of ice melting curve intersects the 8 oC extinction line (22.49 oC) at 2051.3 represents the time when 100 percent of all the ice on the surface of the Earth will have melted. If we make this point on the latent heat of ice melting curve equal to 1 we can determine the time of melting of any fraction of the Earth’s icecaps by using the time*temperature function at each time from 2051.3 back to 2015, the time the average Arctic atmospheric temperature curve is predicted to exceed 0 oC. The process of melting 1 kg of ice and heating the produced water up to a certain temperature is a function of the sum of the latent heat of melting of ice is 334 kilo Joules/kg and the final water temperature times the 4.18 kilo Joules/Kg.K (Wikipedia, 2012). This however represents the energy required over a period of one second to melt 1 kg of ice to water and raise it to the ambient temperature. Therefore the total energy per mass of ice over a certain time period is equal to (334 +(4.18*Ambient Temperature)*time in seconds that the melted water took to reach the ambient temperature. From the fractional time*temperature values at each ambient temperature the fractional amounts of melting of the total global icecaps have been calculated and are shown on Figure 9.
The earliest calculated fractional volume of melting of the global ice caps in 2016 is 1.85*10^-3 of the total volume of global ice with an average yearly rate of ice melting of 2.557*10^-3 of the total volume of global ice. This value is remarkably similar to, but slightly less than the average rate of melting of the Arctic sea ice measured over an 18 year period of 2.7*10^-3 (1978 to 1995; 2.7% per decade – IPCC 2007).This close correlation between observed rates of Arctic ice cap and predicted rates of global ice cap melting indicates that average rates of Arctic ice cap melting between 1979 and 2015 (which represents the projected time the Arctic will lose its ice cover – Masters, 2009) will be continued during the first few years of melting of the global ice caps after the Arctic ice cover has gone in 2015 as the mean Arctic atmospheric temperature starts to climb above 0 oC. However from 2017 the rate of melting of the global ice will start to accelerate as will the atmospheric temperature until by 2049 it will be more than 9 times as fast as it was around 2015 (Table 2).
The mean rate of melting of the global icecap between 2017 and 2049 is some 2*10^-2, some 7.4 times the mean rate of melting of the Arctic ice cap (Table 2). In concert with the increase in rate of global ice cap melting between 2017 and 2049, the acceleration in the rate of melting also increases from 7*10^-4 to 9.9*10^-4 with a mean value close to 8.6*10^-4 (Table 2). The ratio of the acceleration in the rate of global ice cap melting to the Arctic ice cap melting increases from 3.4 in 2017 to 4.8 by 2049 with a mean near 4.2. This fast acceleration in the rate of global ice cap melting after 2015 compared to the Arctic sea ice cap melting before 2015 is because the mean Arctic atmospheric temperature after 2017 is spiraling upward in temperature above 0 oC adding large amounts of additional energy to the ice and causing it to melt back more quickly.
The melt back of the Arctic ice cap is a symptom of the Earth’s disease but not its cause and it is the cause that has to be dealt with if we hope to bring about a cure. Therefore a massive cut back in carbon dioxide emissions should be mandatory for all developed nations (and some developing nations as well). Total destruction of the methane in the Arctic atmosphere is also mandatory if we are to survive the effects of its now catastrophic rate of build up in the atmospheric methane concentration However cooling of the Arctic using geoengineering methods is also vitally important to reduce the effects of the ice cap melting further enhancing the already out of control destabilization of the methane hydrates on the Arctic shelf and slope.
· Developed (and some developing) countries must cut back their carbon dioxide emissions by a very large percentage (50% to 90%) by 2020 to immediately precipitate a cooling of the Earth and its crust. If this is not done the earthquake frequency and methane emissions in the Arctic will continue to grow exponentially leading to our inexorable demise between 2031 to 2051.
· Geoenginering must be used immediately as a cooling method in the Arctic to counteract the effects of the methane buildup in the short term. However these methods will lead to further pollution of the atmosphere in the long term and will not solve the earthquake induced Arctic methane buildup which is going to lead to our annihilation.
· The United States and Russia must immediately develop a net of powerful radio beat frequency transmission stations around the Arctic using the critical 13.56 MHZ beat frequency to break down the methane in the stratosphere and troposphere to nanodiamonds and hydrogen (Light 2011a) . Besides the elimination of the high global warming potential methane, the nanodiamonds may form seeds for light reflecting noctilucent clouds in the stratosphere and a light coloured energy reflecting layer when brought down to the Earth by snow and rain (Light 2011a). HAARP transmission systems are able to electronically vibrate the strong ionospheric electric current that feeds down into the polar areas and are thus the least evasive method of directly eliminating the buildup of methane in those critical regions (Light 2011a).
The warning about extinction is stark. It is remarkable that global scientists had not anticipated a giant buildup of methane in the atmosphere when it had been so clearly predicted 10 to 20 years ago and has been shown to be critically linked to extinction events in the geological record (Kennett et al. 2003). Furthermore all the experiments should have already been done to determine which geoengineering methods were the most effective in oxidising/destroying the methane in the atmosphere in case it should ever build up to a concentration where it posed a threat to humanity. Those methods need to be applied immediately if there is any faint hope of reducing the catastrophic heating effects of the fast building atmospheric methane concentration.
Malcolm Light 9th February, 2012
References
Arctic Methane Emergency Group
ameg.me
Allen, P.A., and Allen, J.R. Basin Analysis, Principles and Applications. Blackwell, Oxford, 451 pp.
Carana, S. 2011b. Light, M.P.R. and Carana, S. 2011c. – Methane linked to seismic activity in the Arctic.
http://arctic-news.blogspot.com/p/seismic-activity.html
Carana, S. 2011g. Runaway Global Warming.
http://geo-engineering.blogspot.com/2011/04/runaway-global-warming.html
Connor, S. 2011. Shock as retreat of Arctic sea ice releases deadly greenhouse gas. Russian research team astonished after finding fountains of methane bubbling to surface. The Independent.
http://www.independent.co.uk/environment/climate-change/shock-as-retreat-of arctic-sea-ice-releases-deadly-greenhouse-gas-6276134.html
DATAWeb, 2011. Combined Data Earth Policy Institute.
www.earth-policy.org/datacenter/…/update29_5x
Dessus, B., and Laponche B., Herve le Treut, 2008. Global Warming: The Significance of Methane bd-bl-hlt January 2008.
http://www.global-chance.org/IMG/pdf/CH4march2008.pdf
Hansen, J. E. 2011. GISS Surface Temperature Analysis. NASA. Goddard Institute for Space Physics. http://data.giss.nasa.gov/cgibin/gistemp/do_nmap.py?year_last=2011&month_last=08&sat=4&sst=1&type=anoms&mean_gen=02&year1=2009&year2=2009&base1=1951&base2=1980&radius=1200&pol=pol
Intergovernmental Panel on Climate Change (IPCC) 1992a. Climate Change. The IPCC Scientific Assessment (Edited by J. J. Houghton, G. J. Jenkins and J. J. Ephraums). Cambridge University Press, Cambridge. U.K.
Intergovernmental Panel on Climate Change (IPCC) 1992b. Climate Change in 1992. The Supplementary report to the IPCC Scientific Assessment (Edited by J. J. Houghton, B. A. Callander and S. K. Varney). Cambridge University Press, Cambridge. U.K.
Intergovernmental Panel on Climate Change (IPCC) 2007a. Fourth Assessment Report on Climate Change 2007. FAO 3.1, Figure 1, WG1, Chapter 3, p. 253.
http://blogs.ei.colombia.edu/wp-content/uploads/2010/12/graph-2-600X422.jpg
Intergovernmental Panel on Climate Change (IPCC) 2007b. Synthesis Report
http://www.ipcc.ch/publications_and_data/ar4/syr/en/spms1.html
Kennet, J.P., Cannariato, K.G., Hendy, I.L., Behl, R.J., 2003. Methane Hydrates in Quaternary Climate Change. The Clathrate Gun Hypothesis, Washington D.C., American Geophysical Union. ISBN 0875902960
Lide. D.R. and Frederikse H.P.R., 1995. CRC Handbook of Chemistry and Physics. 75th Edition, CRC Press, London. pp. 1-1 – 1-33.
Light M.P.R. 2011a. Use of beamed interfering radio frequency transmissions to decompose Arctic atmospheric methane clouds. Edited by Sam Carana.
http://arctic-news.blogspot.com/p/decomposing-atmospheric-methane.html
Lopatin, N.V. 1971. Temperature and geologic time as factors in coalification (in Russian). Akad. Nauk SSSR. Izvestiya. Seriya Geologicheskaya, 3, pp.95 – 106.
Masters. J. 2009. Top Climate Story of 2008. Arctic Sea Ice Loss. Dr Jeff Masters Wunderblog.
http://www.wunderground.com/blog/JeffMasters/comment.html?entrynum=1177
NASA, 2002. Global Temperature Anomalies in 0.1C. Goddard Institute for Space Studies., NASA Goddard Space Flight Center, Earth Sciences Directorate.
http://www.giss.nasa.gov/data, updated December 2002.
Norwegian Polar Institute, 2001. Svalbard, Climate:
http://www.npolar.no/en/the-arctic/svalbard/
NOAA 2011a. Huge sudden atmospheric methane spike Arctic Svalbard (north of – Norway)
http://arctic-news.blogspot.com/p/need-for-geo-engineering.html
NOAA 2011b. Huge sudden methane spike recorded at Barrow (BRW), Alaska, United States. Generated ESRL/GMO – 2011. December 14-17-21 pm
http://arctic-news.blogspot.com/p/need-for-geo-engineering.html
Rianovosti, 2011. Russian, US scientists set to study methane release in Arctic. ScienceRSS
http://en.rian.ru/science/20110902/166364635.html
Semiletov, I. 2011. Quoted from Itar-Tass. Heavy methane emissions found in the Arctic Eastern Sector. Itar-Tass. September 26, 2011.
http://www.itar-tass.com/en/c154/233799.html
Shakel M., 2005. Sustainability: Our Environment.
http://www.earthethicsinstitute.org/facultycurriculum-pdf/sustainability%20exploration20in%Mathematics.pdf
Shakova N., Semiletov, I., Salyuk, A., and Kosmach, D., 2008. Anomalies of methane in the atmosphere over the East Siberian Shelf. Is there any sign of methane leakage from shallow shelf hydrates? EGU General Assembly 2008. Geophysical Research Abstracts, 10, EGU2008-A-01526
http://meetings.copernicus.org/www.cosis.net/abstracts/EGU2008/01526/EGU2008-A-01526.pdf
Shakova, N. and Semiletov, I., 2010a. Methane release from the East Siberian Shelf and the potential for abrupt climate change. Presentation in November 30, 2010.
http://symposium2010.serdp-estcp.org/Technical-Sessions/1A
Shakova N., Semiletov, I., Leifer, I., Salyuk, A., Rekant, P., and Kosmach, D. 2010b. Geochemical and geophysical evidence of methane release over the East Siberian Arctic Shelf. Journal Geophys. Research 115, C08007
http://europa.agu.org/?view=article&uri=/journals/jc/jc1008/2009jcoo5602/2009jc005602.xml
Shakova, N., Semiletov, I., Salyuk, A., Yusupov, V., Kosmach, D., and Gustafsson, O., 2010c. Extensive methane venting to the atmosphere from sediments of the East Siberian Arctic Shelf. Science.
http://www.sciencemag.org/content/327/5970/1246.short
Wignall, P. 2009. Miracle Planet; Episode 4, Part 2. Coproduced by NHK (Japan) and the National Film Board of Canada (NFB).
http://www.youtube.com/watch?v=exfNNDExxic&list=PL0200B1S24E220C5A&feature=playerembedded#
Wikipedia., 2012. Enthalpy of Fusion.
http://en.wikipedia.org/wiki/Enthalpy_of_fusion
The following is a diagram by Sam Carana illustrating the progress
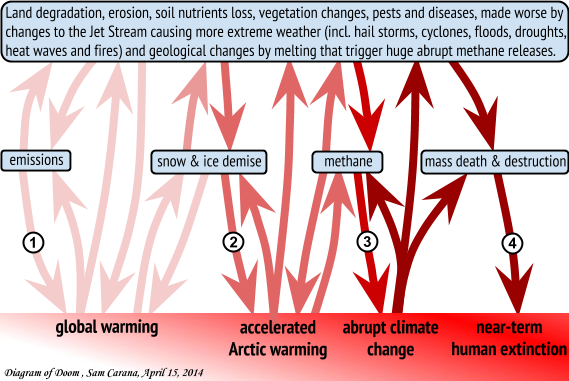
Source: RobinWestenra @ Blogspot
Endangering US Citizens, Gen. Dempsey Approves High Civilian Death Rate Military Tactics

Source: Washington’s Blog
Martin Dempsey, the highest ranking officer in the US, this week endangered the lives of US and other civilians by approving military tactics by foreign nations that result in a 75 to 80% civilian death rate.
Media Blackout as U.S. Sponsors Genocide in Southeastern Ukraine
Source: Washington’s Blog
Here’s a typical example of what’s being blacked-out:
This is a photo of a Ukrainian soldier guiding a truck-full of prisoners toward a ditch, to which the prisoners are then dragged one-by-one, and thrown in, and shot — then covered over with dirt after all the corpses (and perhaps some living bleeding survivors) are piled in it. (Of course, any survivors then quickly choke to death, from the dirt):
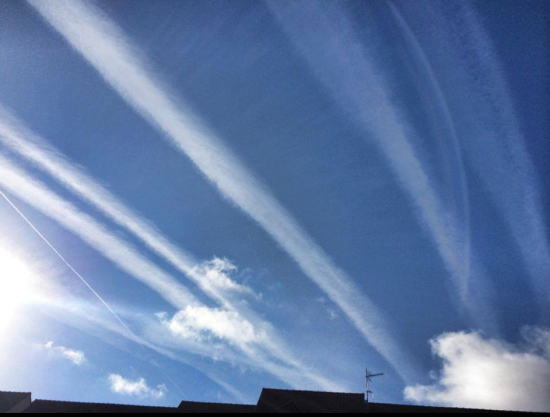
Less Wind, Rain and Sun, Welcome to Geoengineering
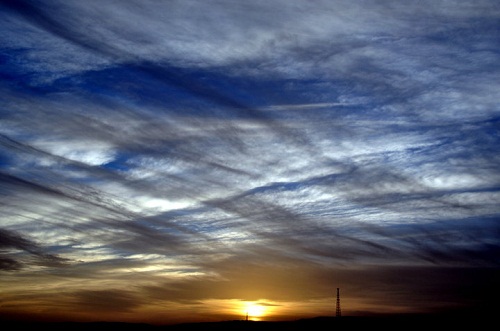
Dane Wigington
geoengineeringwatch.org
The science relating to the effects of an atmosphere saturated with particulates is clear and disturbing: less rain, wind, and sun. Numerous environmental engineering studies have found that the levels of rain, wind, and sun around the world today are likely far less than they should have been and would have been without chemical aerosols decimating our atmosphere. Such studies discuss these problems that can occur with atmospheric aerosols, however most articles, like the one cited below, ignore the “elephant in the room” that geoengineering is by far the largest single source of atmospheric aerosols. A recent report from NOAA even admits to the fact that they just don't know where all these particles are coming from.
Engineered “Polar Vortex” Freezes US
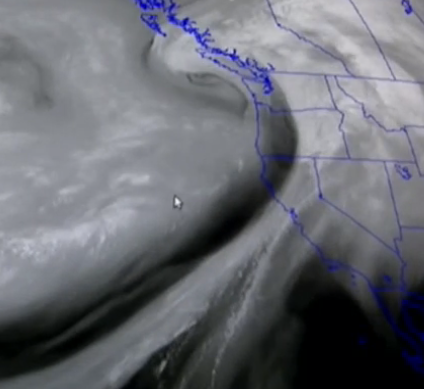
One of the best updates yet from the HAARP is below. I was actually on the US west coast near the Oregon border to witness the all out aerosol assault in the skies which is noted in the attached video. The sea temperatures were exceptionally warm, warm enough to swim in the waves for nearly a half hour with no wet suit. Historically this was not possible to do at any time of year in this location, let alone in mid November. A green sea turtle was recently caught of the coast of Oregon and tuna are being caught of the coast of Alaska, both instances are unprecedented. Global sea temperatures are now officially the warmest ever recorded. Why are the climate engineers working so hard to freeze the Eastern US? To continue the confusion and division amongst the population as to the true state of the climate. To demonstrate their power over the climate system. To hide the true gravity of what is unfolding on our planet for as long as possible while causing unimaginable harm to the biosphere in the process.
Dane Wigington
geoengineeringwatch.org.


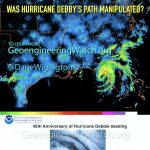


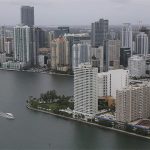


